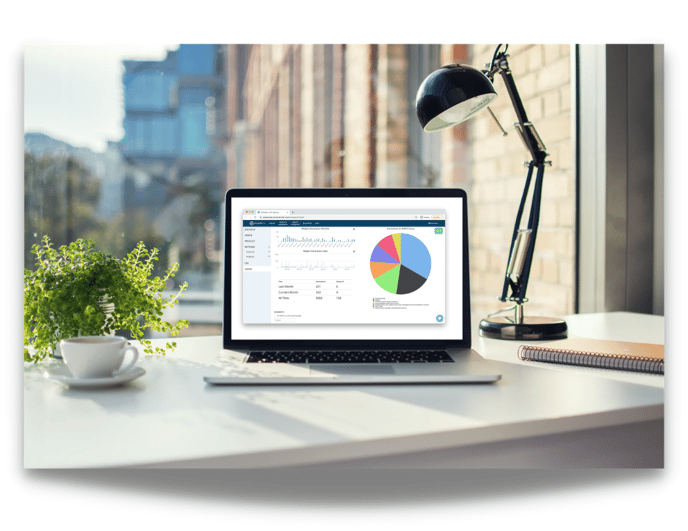
Accessing and Understanding Your Encentiv Data
Learn how you can get the most out of your reporting and analytics with our new Reporting Guide!
Let's start by downloading your reports:
Log into your Widget Portal at http://awareness.encentivizer.com/
- Click Widget in the top navigation menu
- Click Usage in the left-navigation menu
- Choose the Catalog or Payback widget option then add a date range you want to download (leaving this blank will download all of your historical usage to date)
- Click the download icon — the report will download as a CSV file
%20(900%20%C3%97%20650%20px).png?width=655&name=Untitled%20(900%20%C3%97%20700%20px)%20(900%20%C3%97%20650%20px).png)
Now that you have your CSV download, refer to our Reporting & Usage Breakdown for explanations of your usage and a breakdown of each column in both your catalog and payback reports.
Visitor Intelligence
See who is using your widget, as well as the utilities and products they're looking at
All widget subscribers have access to industry-specific tracking on all widget usage, by NAICS or SIC code see what industries are using your widget. See what kinds of companies are looking at the widget, including what products and what utilities specific industries are looking at. This information will appear in your widget reporting.
Here is the data you can expect:
- Industry breakdown [examples: Wholesale Trade, Construction, Real Estate, etc.]
- Which industries are looking at which utilities
- Which industries are looking at which of your product categories
You understand your analytics, now what?
Get the most out of your data by utilizing it in both your sales & marketing strategies. Track your trends. Who is using your widget? We have found that users fall into three categories: distributors & ESCOs, internal team members, and end-users. Which products, regions, and utilities are your users searching, and does this align with your sales data?
Target those segments. Incorporate this data into your sales strategy - use your knowledge of top product categories searched, alert your regional sales teams of trends in their area, and use any given information to generate new sales leads. Get your marketing team involved in the creation of targeted campaigns - emails or sales flyers.
Increase your widget traffic. The more data you have to analyze, the better. Optimize your widget interaction by linking to the widget page from more locations throughout your website. With the referral URL column in your reporting, you’ll be able to see which page is generating the most widget traffic.
For quick reference, remember to download your full copy of the Encentivizer Widget Reporting Guide today!
Finally, here are some ways to help increase your usage.
After analyzing your trends and usage, you might be looking for some ways to increase your widget traffic. Here are some tips that will help you accomplish that goal!
- Link to the widget page from more locations throughout your website. With the referral URL in your reporting, you’ll be able to see which page is generating the most widget traffic.
- Feature the widget on more than one page. Either by having category-specific widgets on different pages or your full catalog widget in multiple locations. The best way to incorporate this into your strategy is to add it to several pages, test, optimize, and then keep it on the pages that it works best. You don’t know what works until you try!
- Use it in email marketing campaigns. Here are some ideas of how to incorporate it into your email campaigns!